Demographics and Community Evolution
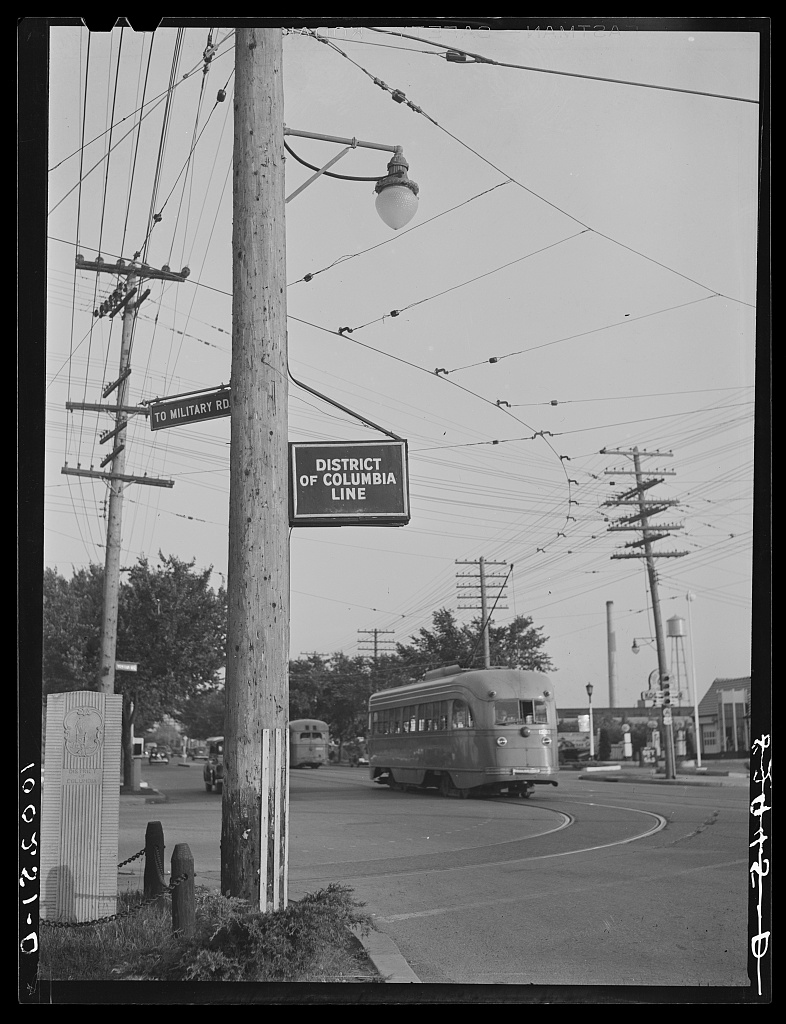 The District of Columbia and Maryland boundary line at Wisconsin Avenue in the evening, 1942. This border at Friendship Heights marks where D.C. ends and Chevy Chase, Maryland begins. Photo by Marjory Collins, Library of Congress.
The demographics of Upper Northwest Washington, D.C. have changed dramatically over the centuries, from indigenous inhabitants to rural farmers, from working-class communities to some of the most affluent neighborhoods in the nation's capital.
Pre-Colonial Population
The Nacotchtank
- Population: Approximately 300 members
- Part of: The larger Piscataway Chiefdom (7,000+ members)
- Economy: Trading, agriculture (corn, beans, squash), hunting
By the late 1600s, European diseases had decimated the Nacotchtank population. The survivors relocated to Theodore Roosevelt Island (1668) and eventually merged with the Piscataway tribe, migrating north to Pennsylvania around 1700.
Colonial and Early Republic Era (1700s-1850s)
Rural Agricultural Character
The area was sparsely populated with: - Scattered farmsteads - Small landholdings - The village of Tennallytown serving travelers
Population Centers
- Tennallytown village: A few dozen residents clustered around the tavern
- Surrounding farms: Isolated homesteads
Civil War Era (1861-1865)
Military Population
The construction of Fort Reno brought a dramatic temporary population increase: - 3,000 soldiers stationed at Fort Reno at its peak - Additional garrison troops in Tenleytown - Camp followers and service providers
Contraband Camps
During the war, enslaved people escaping to Union lines settled near the fort, laying the groundwork for the post-war Reno City community.
Post-War Era: Reno City (1866-1920s)
Demographics
Reno City was a unique community: - Approximately 100 homes - 75% African American, 25% white - One of the few racially integrated communities in segregated Washington
Economic Character
- Working-class residents
- Small businesses
- The Jesse Reno School (1903) served African American children
Destruction and Displacement
In the 1920s, the entire community was displaced when the government condemned and demolished Reno City to build schools and parks for the growing white middle-class population.
The Streetcar Era (1890-1940s)
Population Growth
The electric streetcar (1890) enabled rapid population growth: - White middle-class families moved from the city center - New subdivisions appeared throughout the 1920s - Population shifted from rural farmers to suburban commuters
Racial Composition
The developing neighborhoods were explicitly designed for white residents: - Restrictive deed covenants excluded African Americans, Jews, and other minorities - Reno City's destruction removed the area's African American population - Schools were segregated
Modern Demographics
Current Population Snapshot (Tenleytown Area)
Based on recent census and demographic data:
Total Population - Approximately 34,422 residents in the Tenleytown area
Age - Median age: 39.8 years
Gender - Males: 46.28% - Females: 53.72%
Citizenship Status
- U.S.-born citizens: 78.83%
- Naturalized citizens: 13.08%
- Non-citizens: 8.09%
Employment
Workforce Composition - White-collar workers: 97.76% - Blue-collar workers: 2.24%
Employment Types - Private company employees: 43.72% (7,480 workers) - Government employees: 22.51% (3,852 workers) - Entrepreneurs/Self-employed: 13.33% (2,281 workers)
Households
- Total households: 14,092
- Average household size: ~2 members
- Family households: 52.15%
- Non-family households: 47.85%
Economic Evolution
From Agriculture to Services
| Era | Primary Economy |
|---|---|
| 1790-1890 | Agriculture (farms, dairies, orchards) |
| 1890-1940 | Mixed (small businesses, streetcar workers) |
| 1940-1980 | Retail (Sears, local shops) |
| 1980-Present | Professional services, government |
Real Estate Values
- Affordable housing drew young families to AU Park starting in the early 1990s
- Real estate values have more than doubled since then
- The area is now among the most expensive in Washington, D.C.
Educational Attainment
The Upper Northwest neighborhoods have among the highest educational attainment levels in the District: - High concentration of graduate and professional degrees - Proximity to American University influences demographics - Strong public schools attract educated families
Demographic Themes
1. From Diversity to Homogeneity (and Back?)
The area has followed a complex demographic arc: - Pre-colonial: Indigenous Nacotchtank population - 1866-1920s: Racially integrated Reno City - 1920s-1960s: Deliberately homogenized through restrictive covenants and forced displacement - 1970s-Present: Gradual diversification following end of legal discrimination
2. The Rise of the Professional Class
Upper Northwest evolved from: - Farmers and tavern-keepers (1790s-1890) - Streetcar workers and small shopkeepers (1890-1940) - Middle-class professionals (1940-present) - Today's highly educated, white-collar population
3. Student Population
American University's presence creates a transient student population that affects: - Rental housing demand - Local business character - Seasonal population fluctuations
4. Aging in Place
Like many established neighborhoods, Upper Northwest has seen: - Long-term residents aging in place - Competition between downsizing seniors and young families - Tension over development and density
Census Resources
For detailed demographic data, consult:
DC Office of Planning
- 2020 Census Data: Population totals and demographic characteristics
- 2010 Census Data: Historical comparison
- American Community Survey (ACS): Ongoing demographic, housing, social, and economic profiles
Geographic Challenges
Unlike other geographic entities, neighborhoods are not officially recognized by the U.S. Census Bureau. Demographic statistics must be computed as weighted sums or averages of the census tracts or block groups that overlap the neighborhood.
The Neighborhood Today
Defining Characteristics
- Highly educated: Among the highest educational attainment in DC
- Affluent: High incomes, expensive real estate
- Professional: Nearly 98% white-collar workforce
- Family-oriented: Strong schools, single-family homes
- Politically engaged: High voter participation
Challenges
- Affordability: Rising prices exclude many potential residents
- Diversity: Historic homogeneity persists despite legal changes
- Development pressure: Balancing preservation with growth
- Transportation: Debates over traffic, parking, and transit-oriented development
Looking Forward
The Wisconsin Avenue Development Framework (2024) envisions: - Expanded housing including affordable units - Transit-oriented development near Metro stations - Maintained neighborhood character in residential areas - Recognition of historic resources while allowing growth